
Blog
UTM Tagging for B2B SaaS: Parameters, Structure, and Why They Break
UTM tagging explained for B2B SaaS: the five parameters, a naming structure for paid campaigns, and the three points where UTM data is lost before the CRM.
Touchpoint analysis shows which buyer interactions move B2B SaaS deals forward. Pair it with conversion funnel analysis to get past last-touch bias.
 Ishan ManchandaNov 5, 2026

UTM tagging explained for B2B SaaS: the five parameters, a naming structure for paid campaigns, and the three points where UTM data is lost before the CRM.

78% of form fills never become SQLs. The shared metrics - cost per SQL, MQL-to-SQL by channel, pipeline coverage - a RevOps dashboard must show both teams.
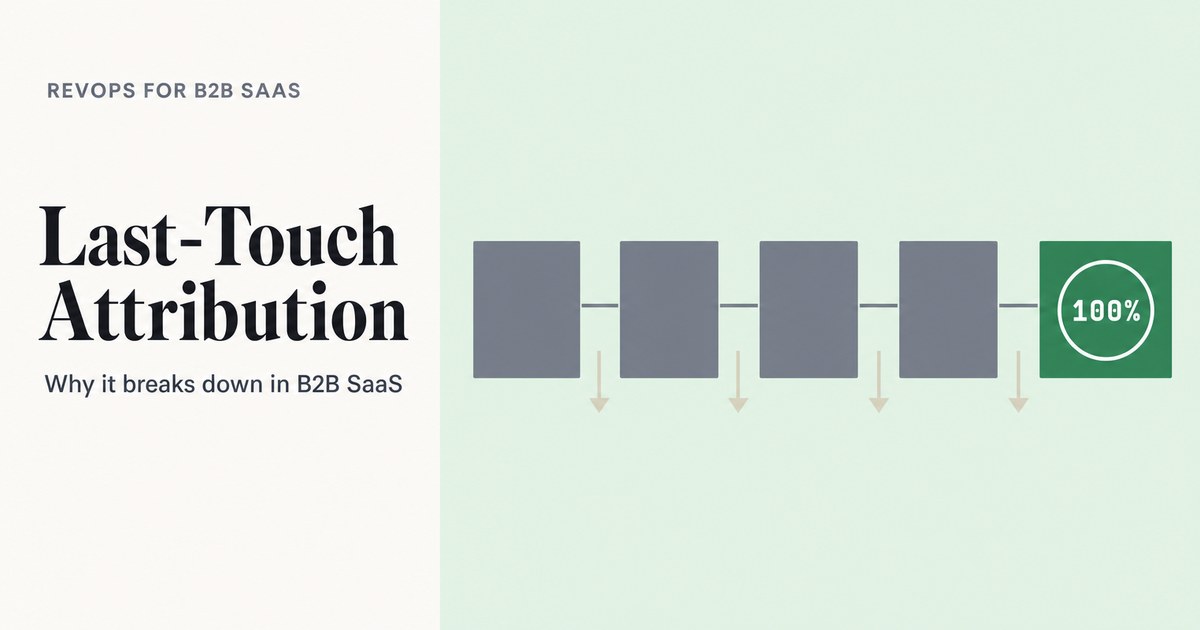
Last-touch attribution gives 100% of deal credit to the final touchpoint. Learn what it is, how it works, and why it distorts budget decisions in B2B SaaS.
Request a quote and our experts will contact you within 24 hours with tailored solutions and pricing.
Last updated: Nov 5, 2026
By the Editorial Team | Published November 4, 2026
Touchpoint analysis is the practice of recording every interaction a buyer has with a B2B SaaS company before closing and measuring which of those interactions moved an opportunity from one funnel stage to the next. When branded search gets credit for every closed-won deal in the customer relationship management (CRM) system, the work that actually moved buyers is invisible. Dreamdata's 2026 benchmarks put the average B2B journey at 272 days (Dreamdata, 2026), so a great deal happens before any form fill. This guide defines touchpoint analysis and conversion funnel analysis as two linked techniques in revenue operations (RevOps), then shows how to run both. For the model choices behind it, see attribution models in B2B marketing.
Key Takeaways
- Touchpoint analysis shows which buyer interactions sit before each stage change; conversion funnel analysis shows where buyers drop out between stages.
- Last-touch attribution gives 100% of the credit to the final recorded interaction, so when branded search is that click it collects credit for earlier work.
- Running both techniques needs three CRM basics: written stage definitions, touchpoints tied to contacts, accounts and opportunities, and a self-reported source field.
- Multi-touch attribution only credits touches a company can see, so it needs a self-reported cross-check.
Touchpoint analysis in B2B marketing is the review of every recorded buyer interaction, such as ads, content views, webinars, emails and sales calls, tied to the accounts and opportunities those interactions influenced. Dreamdata's 2026 benchmarks report 88 touchpoints across 10 stakeholders alongside a 272-day average journey (Dreamdata, 2026). The aim is to see which touches precede stage progression and closed-won revenue.

A touchpoint is any recorded interaction between a buyer and the company, whether paid, owned or human. In a B2B SaaS pipeline, the common ones are:
Each one needs a timestamp, a source and a link to a person and an account. Without those three fields, a touch cannot be placed in the funnel.
Dreamdata's benchmark reports that buyers spend the first 220 days, roughly seven months, forming decisions through content and self-education before entering the sales pipeline (Dreamdata, 2026). Dreamdata put it plainly in its press release: "B2B deals are essentially won before sales get involved in the process." (Dreamdata, 2026) Dreamdata is an attribution vendor, so treat the figures as vendor data with a stated method.
Other research points the same way on the research stage. 6sense's 2025 Buyer Experience Report found the research and seller-engagement split moved from 70/30 to 60/40, and average buying cycles shortened from about 11 months to 10 months (6sense, 2025). The two reports measure different samples, so read the cycle lengths as separate benchmarks, not a conflict. Both show that most buying work happens before a rep is involved.
Customer journey mapping is a design exercise that sketches the path a buyer is expected to take, while touchpoint analysis measures the path buyers actually took and links it to pipeline. The first is a hypothesis; the second is a test of it.
Conversion funnel analysis is the measurement of how many leads and opportunities move from one funnel stage to the next, and how long each move takes. In a B2B SaaS revenue operations model it runs on written stage definitions in the CRM. Published conversion from marketing-qualified lead (MQL) to sales-qualified lead (SQL) across B2B sectors is 12-21%, with a median of about 15% (The Digital Bloom, 2025).

That Digital Bloom figure is a compilation of public reports, not primary research. Treat it as a published benchmark range. The sharper use of funnel analysis is to compare sources with each other, not to chase one blended rate. The sales conversion rate benchmarks by stage and channel cover those ranges in more depth.
Conversion funnel analysis finds the leak; touchpoint analysis explains it. If MQL to SQL conversion drops for one channel, the touchpoint view shows which interactions those lost leads had, and which interactions the converted leads had instead.
Published rates differ because sources define stages differently. Do not average them.
| Source | Sample | Segment | MQL to SQL rate |
|---|---|---|---|
| First Page Sage (June 2025) | 50+ clients | Paid search | 26% |
| First Page Sage (June 2025) | 50+ clients | 30% | |
| First Page Sage (June 2025) | 50+ clients | SEO | 51% |
| GrowthSpree (April 2026) | No sample stated | B2B SaaS Google Ads | 13% to 18% (median) |
| The Digital Bloom (2025) | Compilation of public reports | Across B2B sectors | 12-21% (median about 15%) |
Use these as starting ranges only. Segment by channel and contract size, then compare against the company's own stage definitions.
Branded search gets credit for closed-won deals when it is the last recorded click before a demo request. Last-touch attribution is a model that gives 100% of the credit for a conversion to the final recorded interaction. Longer journeys make it worse: Dreamdata's 2026 benchmarks show the average journey lengthened from 211 days to 272 days (Dreamdata, 2026).

The longer window gives branded search more time to collect credit for earlier work. According to the same benchmark, B2B marketers now own 81% of the full buyer journey (Dreamdata, 2026). Most of that ownership never shows in a last-touch report.
Multi-touch attribution is a model that spreads credit for a conversion across several recorded interactions in the buyer journey. A PartnerStack survey of senior marketing and partner leaders found that 42% of B2B SaaS companies attribute partner-generated revenue with multi-touch, versus 31% first-touch and 19% last-touch (PartnerStack Research Lab, 2025). The sample size is not stated, and the figures cover partner revenue only.
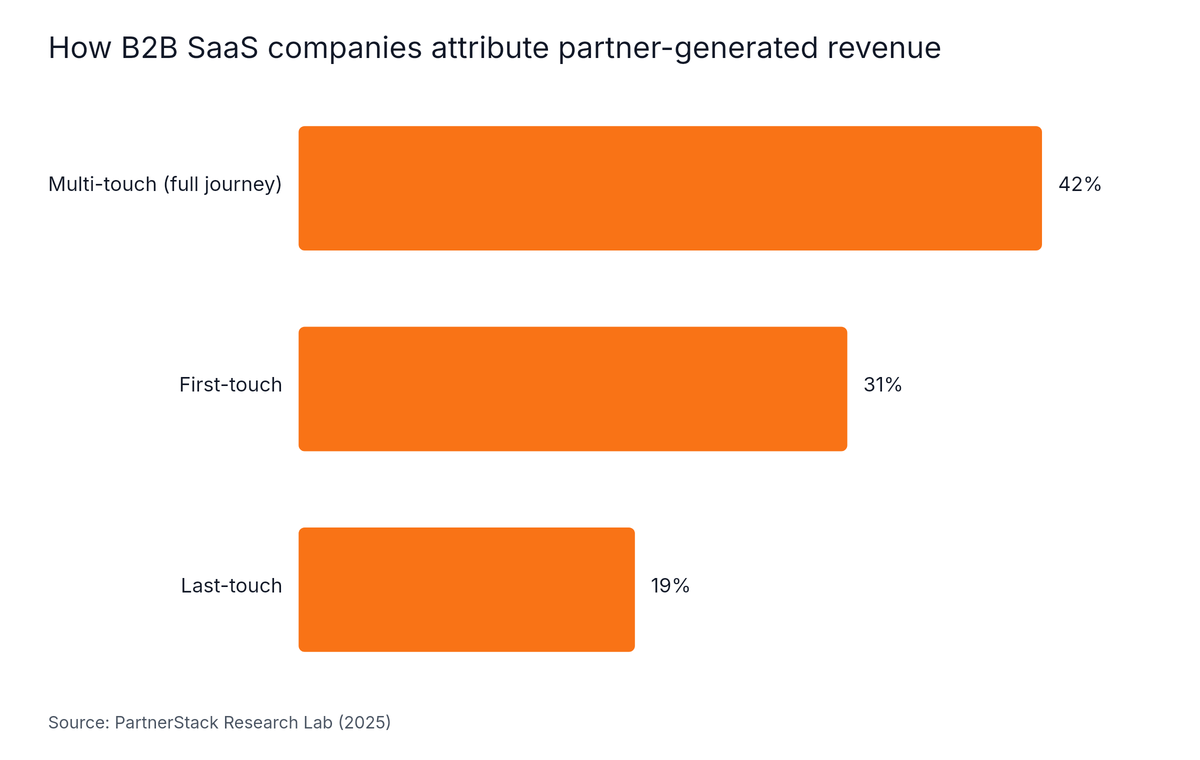
Source: PartnerStack Research Lab, 2025
A June 2026 study of 104 audited Google Ads accounts, covering $78.0M in spend, measured how far form fills and click data reached the CRM.
Study finding: 78% of form fills in 104 audited Google Ads accounts never became a sales-qualified lead, and 91% of the accounts had no Google click ID (GCLID) reaching the CRM. After a 90-day attribution fix, the share of closed-won deals traced to a campaign went from 0% to 67% (GrowthSpree, June 2026).
Google Ads uses data-driven attribution by default, and other models are no longer supported inside the platform. For cross-channel reporting, a combination of multi-touch attribution, a self-reported source field and branded search lift analysis gives a fuller picture than any single model.
Running touchpoint analysis and conversion funnel analysis together means pulling closed-won opportunities from the CRM, attaching every logged touch to account and contact roles, comparing last-touch, first-touch and position-based credit, and building a stage-by-touchpoint matrix. Dreamdata's 2026 benchmarks report 88 touchpoints across 10 stakeholders (Dreamdata, 2026), so each deal has many touches to place.

| Funnel stage | Touches to count before entry | Question it answers |
|---|---|---|
| Lead to MQL | Ads, content views, webinars | Which touches create qualified demand? |
| MQL to SQL | Email replies, pricing views, first sales call | Which touches precede sales acceptance? |
| SQL to opportunity | Demo attendance, stakeholder visits | Which touches add buying-group members? |
| Opportunity to closed-won | Proposal views, reference calls | Which touches sit near the decision? |
Attach touchpoints to contacts, accounts and opportunities, not only to leads. B2B SaaS deals involve a buying group, so account-level credit matters.
| CRM object | What to store | Why it matters |
|---|---|---|
| Contact | Touch history, opportunity contact role | Shows which stakeholders engaged |
| Account | Rolled-up touches from all contacts | Gives buying-group credit |
| Opportunity | Stage-entry timestamps, source, GCLID | Links touches to closed-won |
| Touchpoint record | Consistent UTM and campaign ID, date, channel | Makes models comparable |
For paid channels, store the click ID with every lead and send qualified stages back daily. Google moved custom offline uploads to the Data Manager API from June 15, 2026. A marketing and sales reporting dashboard can then show source, stage and credit side by side, and the revenue operations software guide covers what the stack needs to support it.
Pick five recent closed-won deals. Trace each from first touch to close by hand, then confirm the CRM shows the same sequence. If the CRM misses touches the rep remembers, the data model has gaps.
Bring a funnel, CRM or reporting question to a free consultation: Meet with an expert.
Touchpoint analysis only credits touches that a company can see and tie to a person or account. Podcasts, Slack groups, peer recommendations and AI assistants leave no record, so multi-touch reports undercount them. Gartner's March 2026 survey of 646 buyers found 67% prefer a rep-free experience (Gartner, 2026), which moves more buying activity out of CRM view.

The dark funnel is buyer research and influence that leaves no tracked record in the CRM or analytics tools. No tier 1 or 2 source quantifies the dark funnel's share, so this guide gives no figure. The same Gartner survey found 45% of buyers used AI during a recent purchase (Gartner, 2026), and that research rarely appears in a CRM. Gartner's May 2026 release found 69% of buyers still turn to sales reps to validate AI-generated insights (Gartner, 2026). Touchpoint analysis therefore has to cover both AI-assisted research and the human validation that follows.
Self-reported attribution is a source measure taken from buyers' own answers to a 'how did you hear about us' question. Pair it with incrementality tests and, for larger budgets, marketing mix modeling.
Conversion funnel analysis is the measurement of how many leads and opportunities move between written funnel stages, and how long each move takes. In revenue operations it shows where B2B SaaS pipeline leaks, compares sources such as paid search, LinkedIn and SEO, and flags stage definitions that need review. Rates differ by channel and stage definition, so benchmark against your own definitions.
Customer journey mapping is a design exercise that lays out the stages a buyer is expected to pass through, while touchpoint analysis measures the interactions that actually happened and how they relate to pipeline. Mapping is mostly qualitative. Touchpoint analysis in B2B SaaS is quantitative and tied to opportunities and closed-won revenue in the CRM.
Multi-touch attribution is more accurate than single-touch models only when tracking is complete, because it credits only the touches a company can see. Podcasts, peer recommendations and AI assistants leave no record. Pair it with a self-reported source field and incrementality tests, and treat any single accuracy percentage with no stated method as opinion.
Add a free-text field labeled 'How did you hear about us?' to every demo request form, store the answer on the contact record in the CRM, and report it beside last-touch source. Free text lets buyers name podcasts, communities and AI assistants that tracking cannot record. Review the answers monthly against closed-won deals.
Touchpoint analysis and conversion funnel analysis answer two halves of one question. The funnel view finds where B2B SaaS buyers drop out. The touchpoint view shows which interactions came before each stage change.
The next step is small. Trace five closed-won deals by hand and see how much credit branded search holds. A marketing and sales reporting dashboard is the natural place to keep the result visible for both teams.
Written by
Ishan Manchanda
Ishan Manchanda is co-founder of GrowthSpree, a B2B SaaS marketing consultancy founded in 2017 that has managed $60M+ in ad spend across 300+ B2B SaaS companies. He focuses on demand generation, go-to-market strategy and pipeline growth, and has been featured in Silicon Valley Times, SaaS Mag and the Unbounce podcast.
© 2026 RevOps for B2B SaaS All rights reserved.